How can we get more insight into the actual effect of changes we make to our sleep and workout habits, try to identify a long term effect for the vitamins and nootropics we’re trying?
There’s a never ending parade of new products and services we can sign up for to optimize ourselves, but the work to understand the effect on our wellness and performance is still at its earliest stages. Theoretically, gathering your own data and examining it should help with understanding whether there’s a long term change and inspiring the motivation to keep working on a new habit. But without a visual representation of that data, it’s hard to see patterns across multiple data sets from several wearables and self-administered surveys.
Two groups, Open Humans and Quantified Self, have built communities, infrastructure, and protocols that have made incredible advancements for individuals wishing to push the edge of research on the self. This is our contribution to that work. We wanted to see how glyphs might add value to wearables like the Apple Watch and Oura ring, and tools like blood glucose monitors and food tracker apps.
If glyphs can help us resolve some of the complexity in these combined data sets, then maybe we can get self-improvement to feel more like we’re tweaking elegant routines, than avoiding the bludgeon of draconian protocols.
Oura Daily Scores
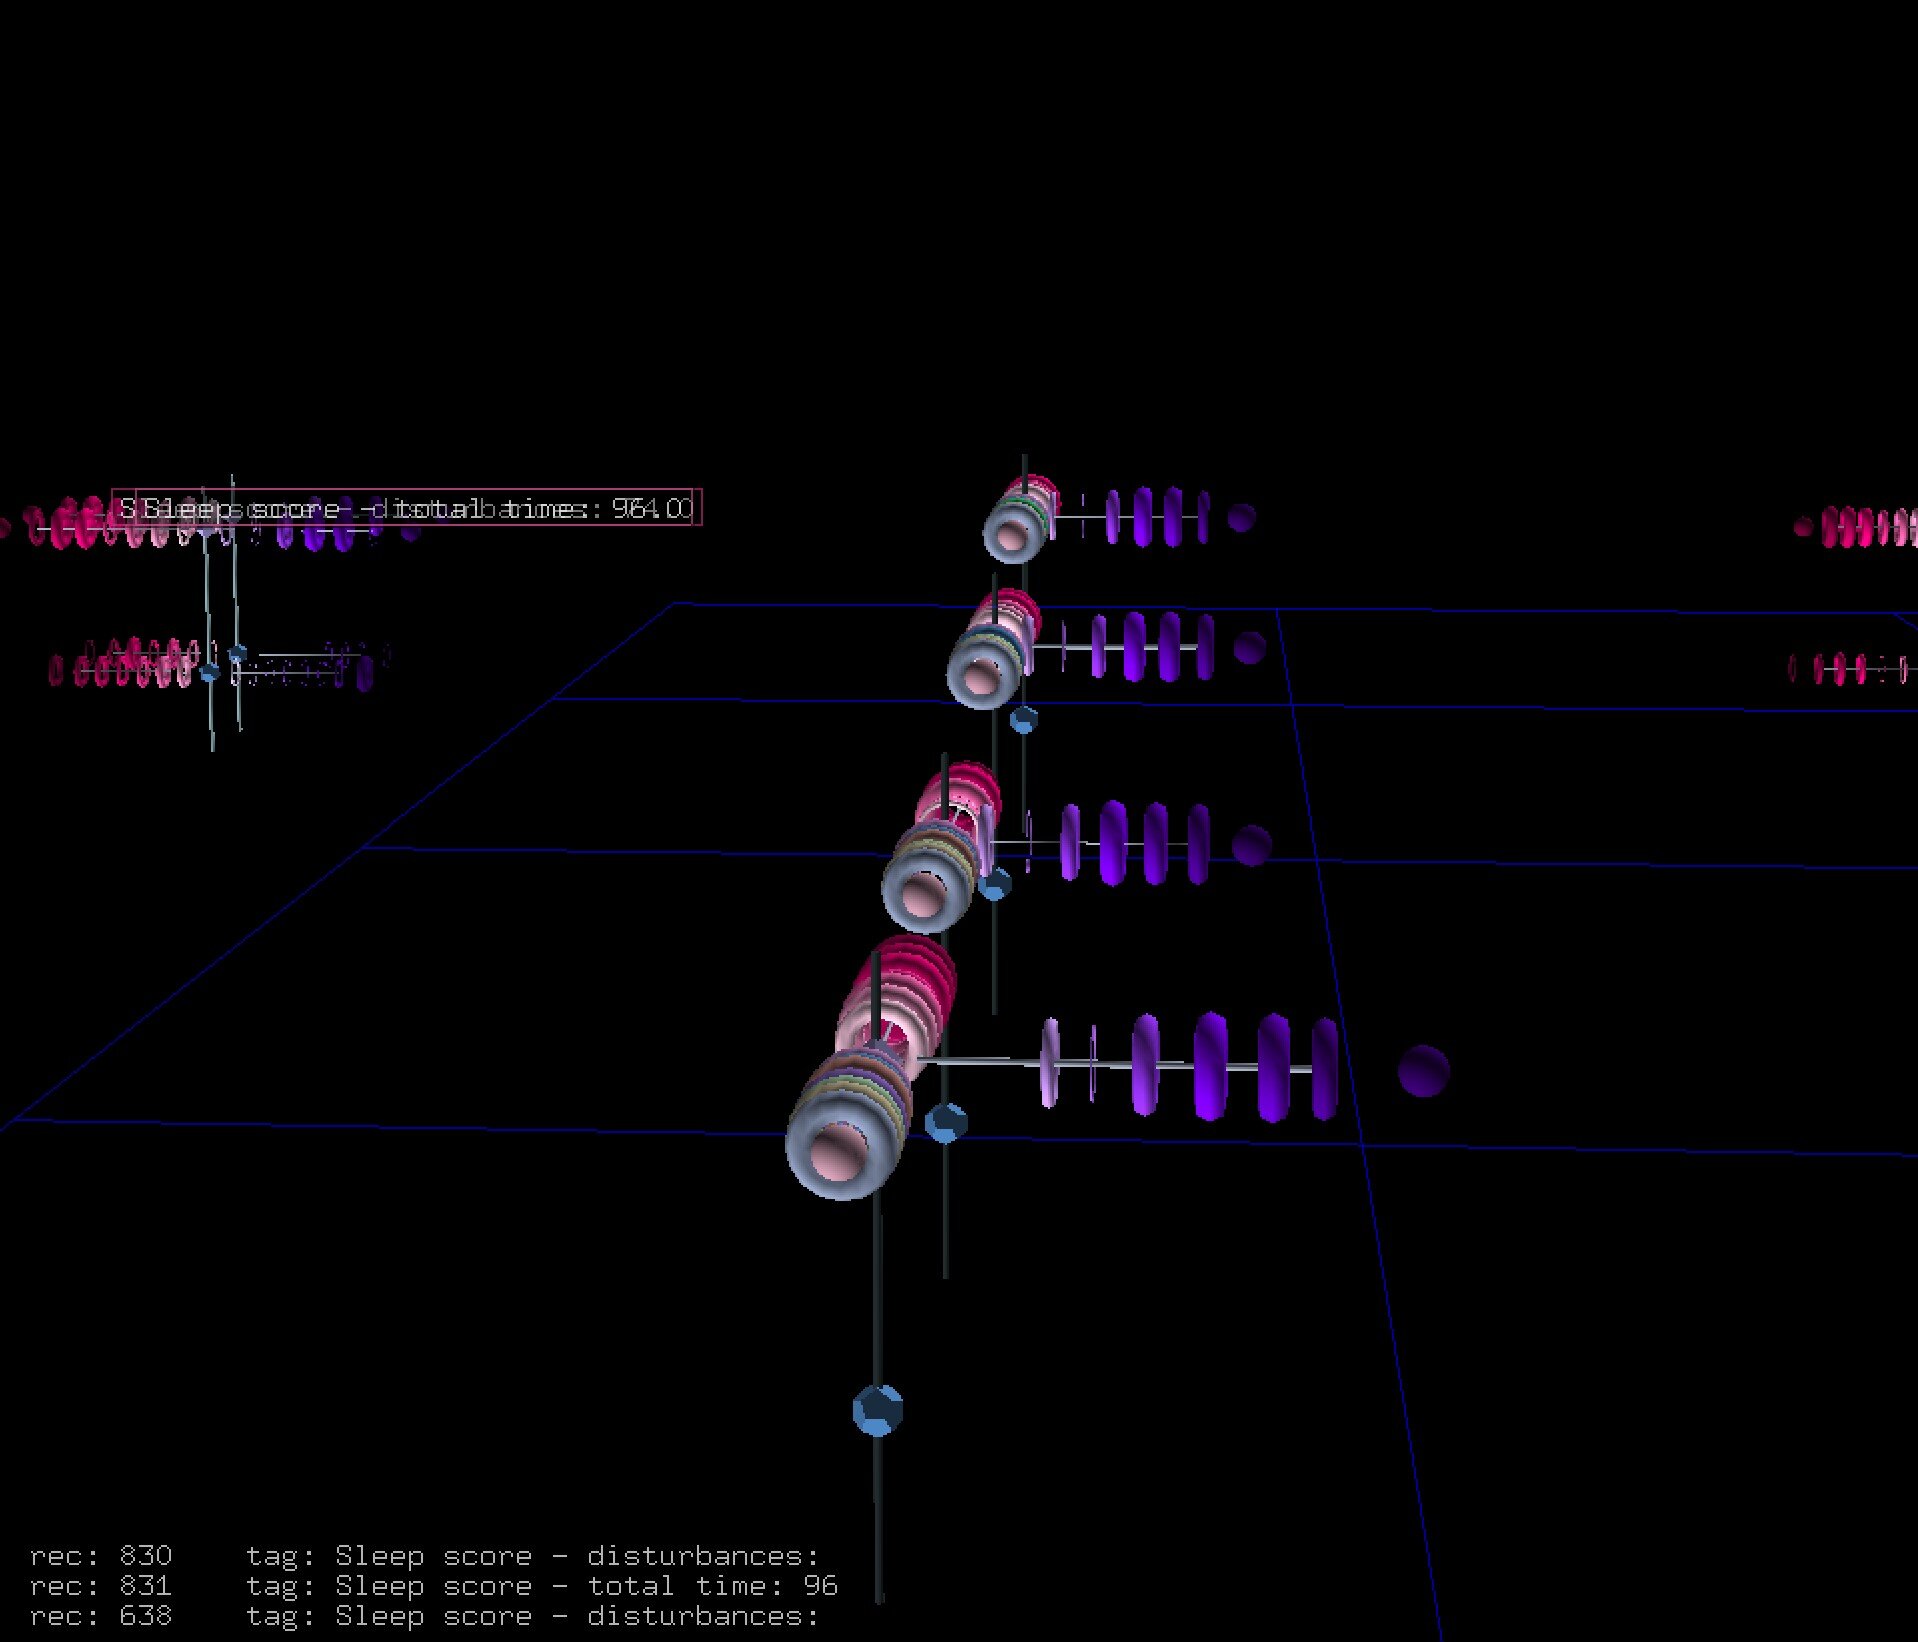
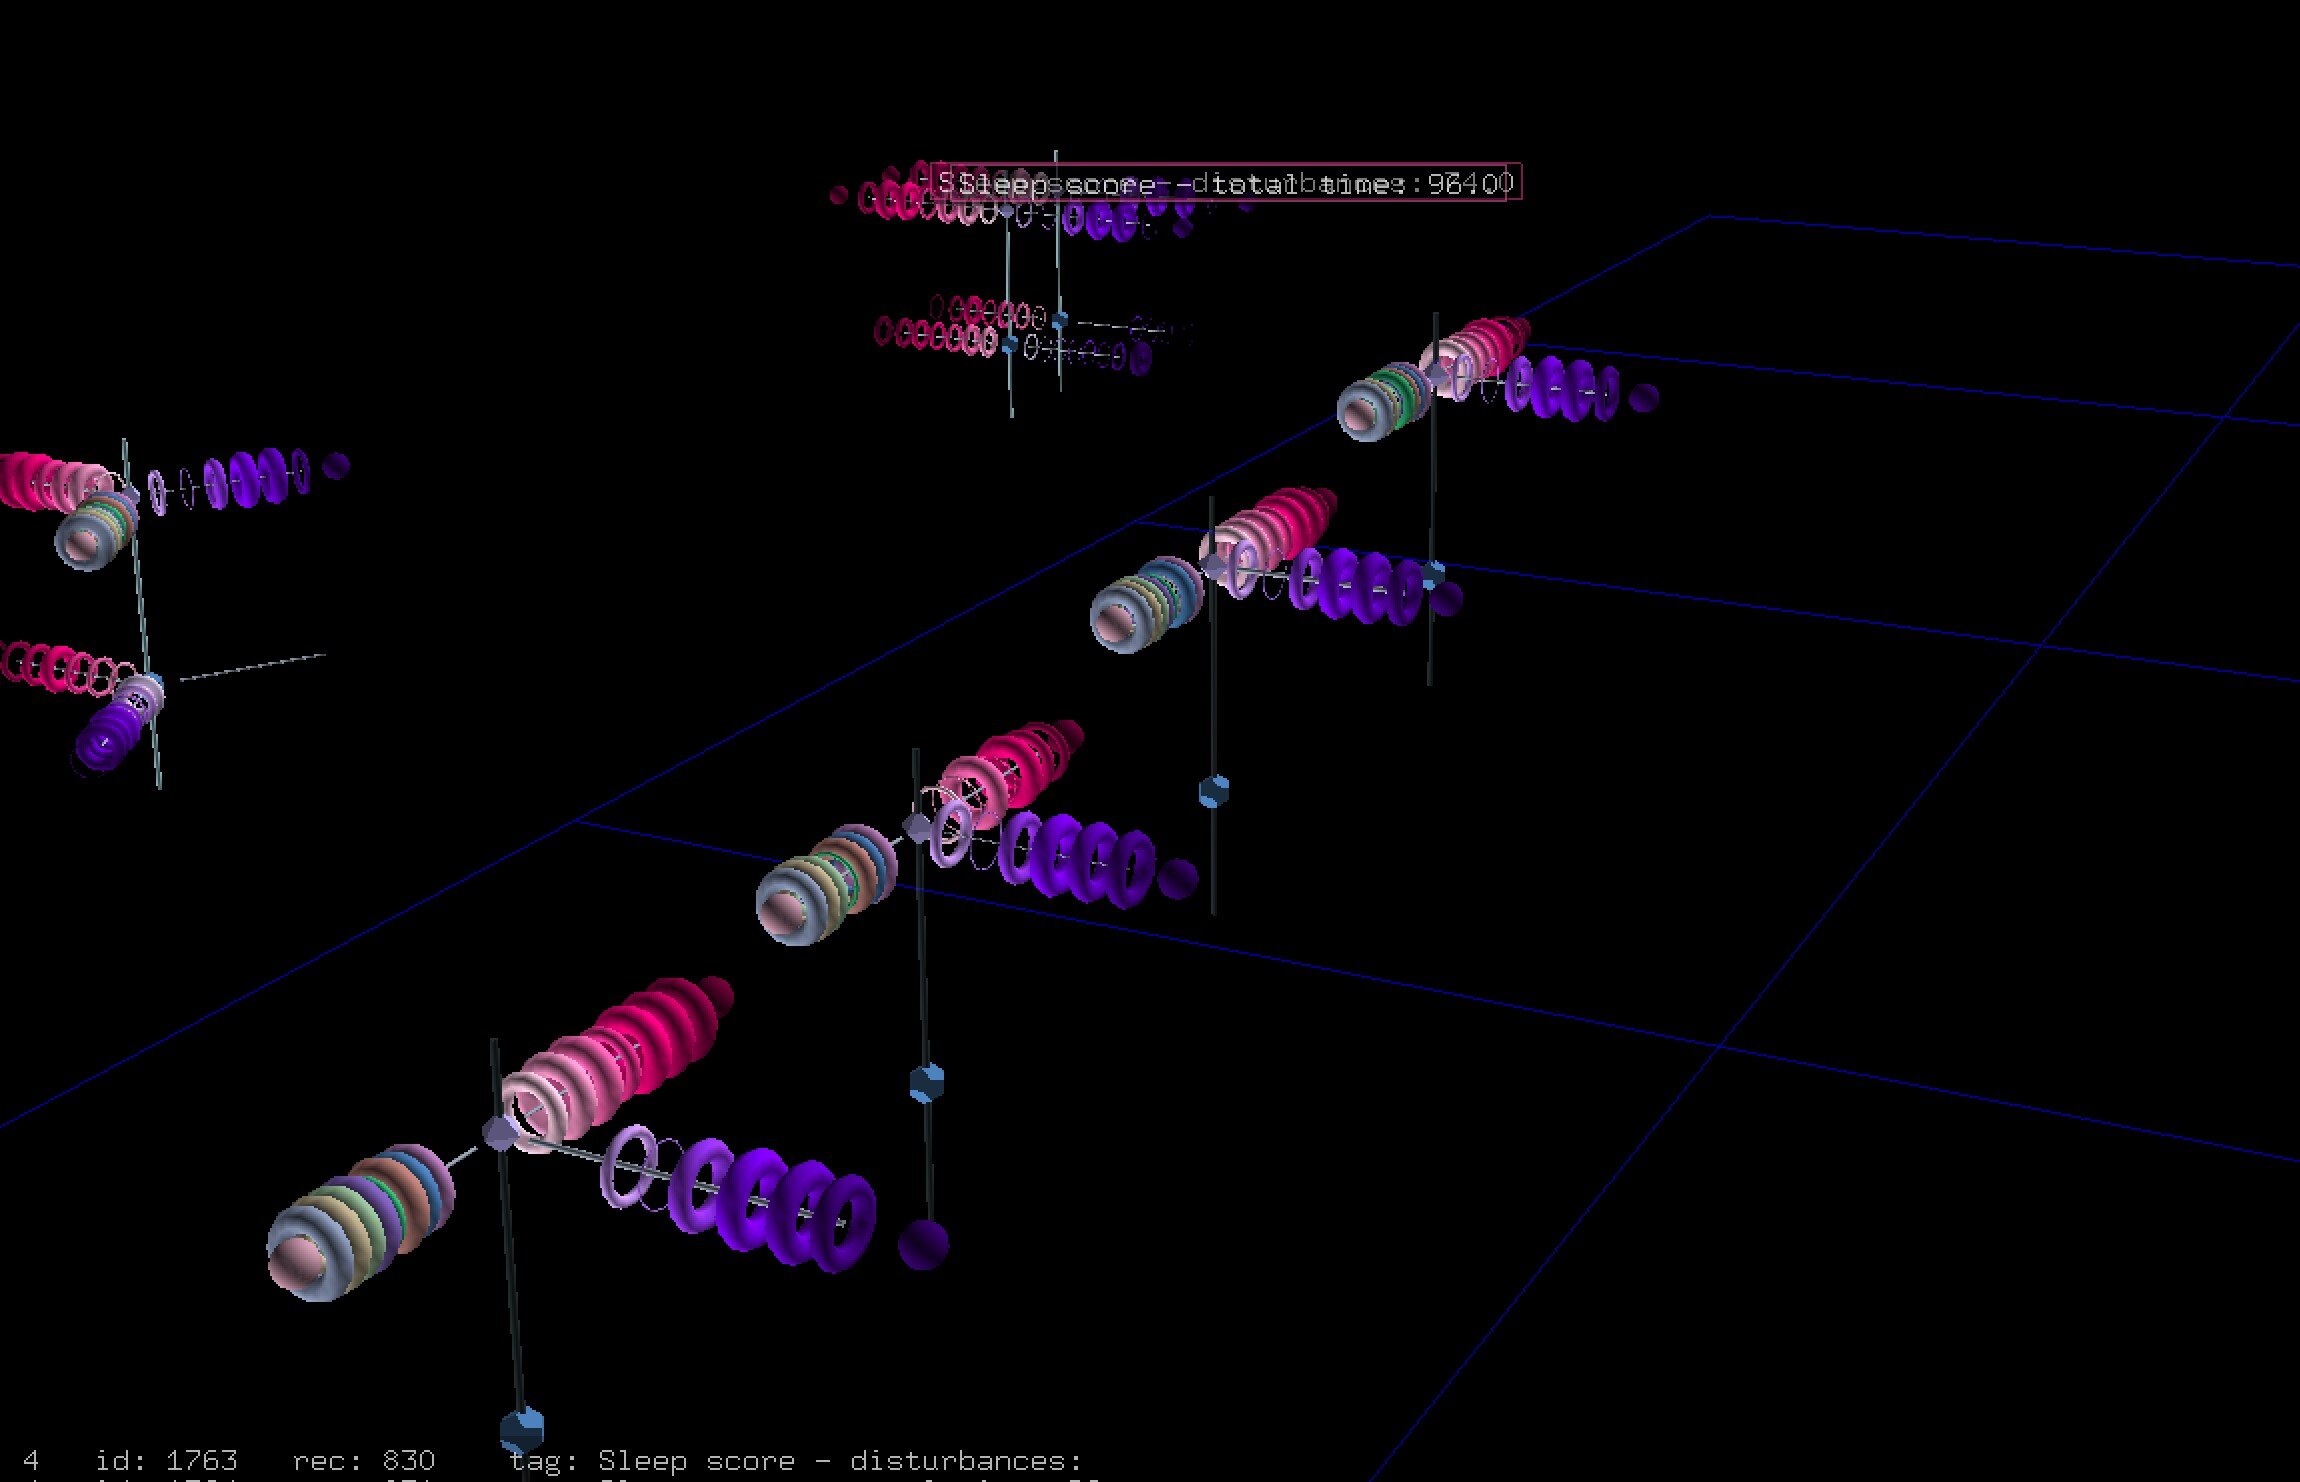
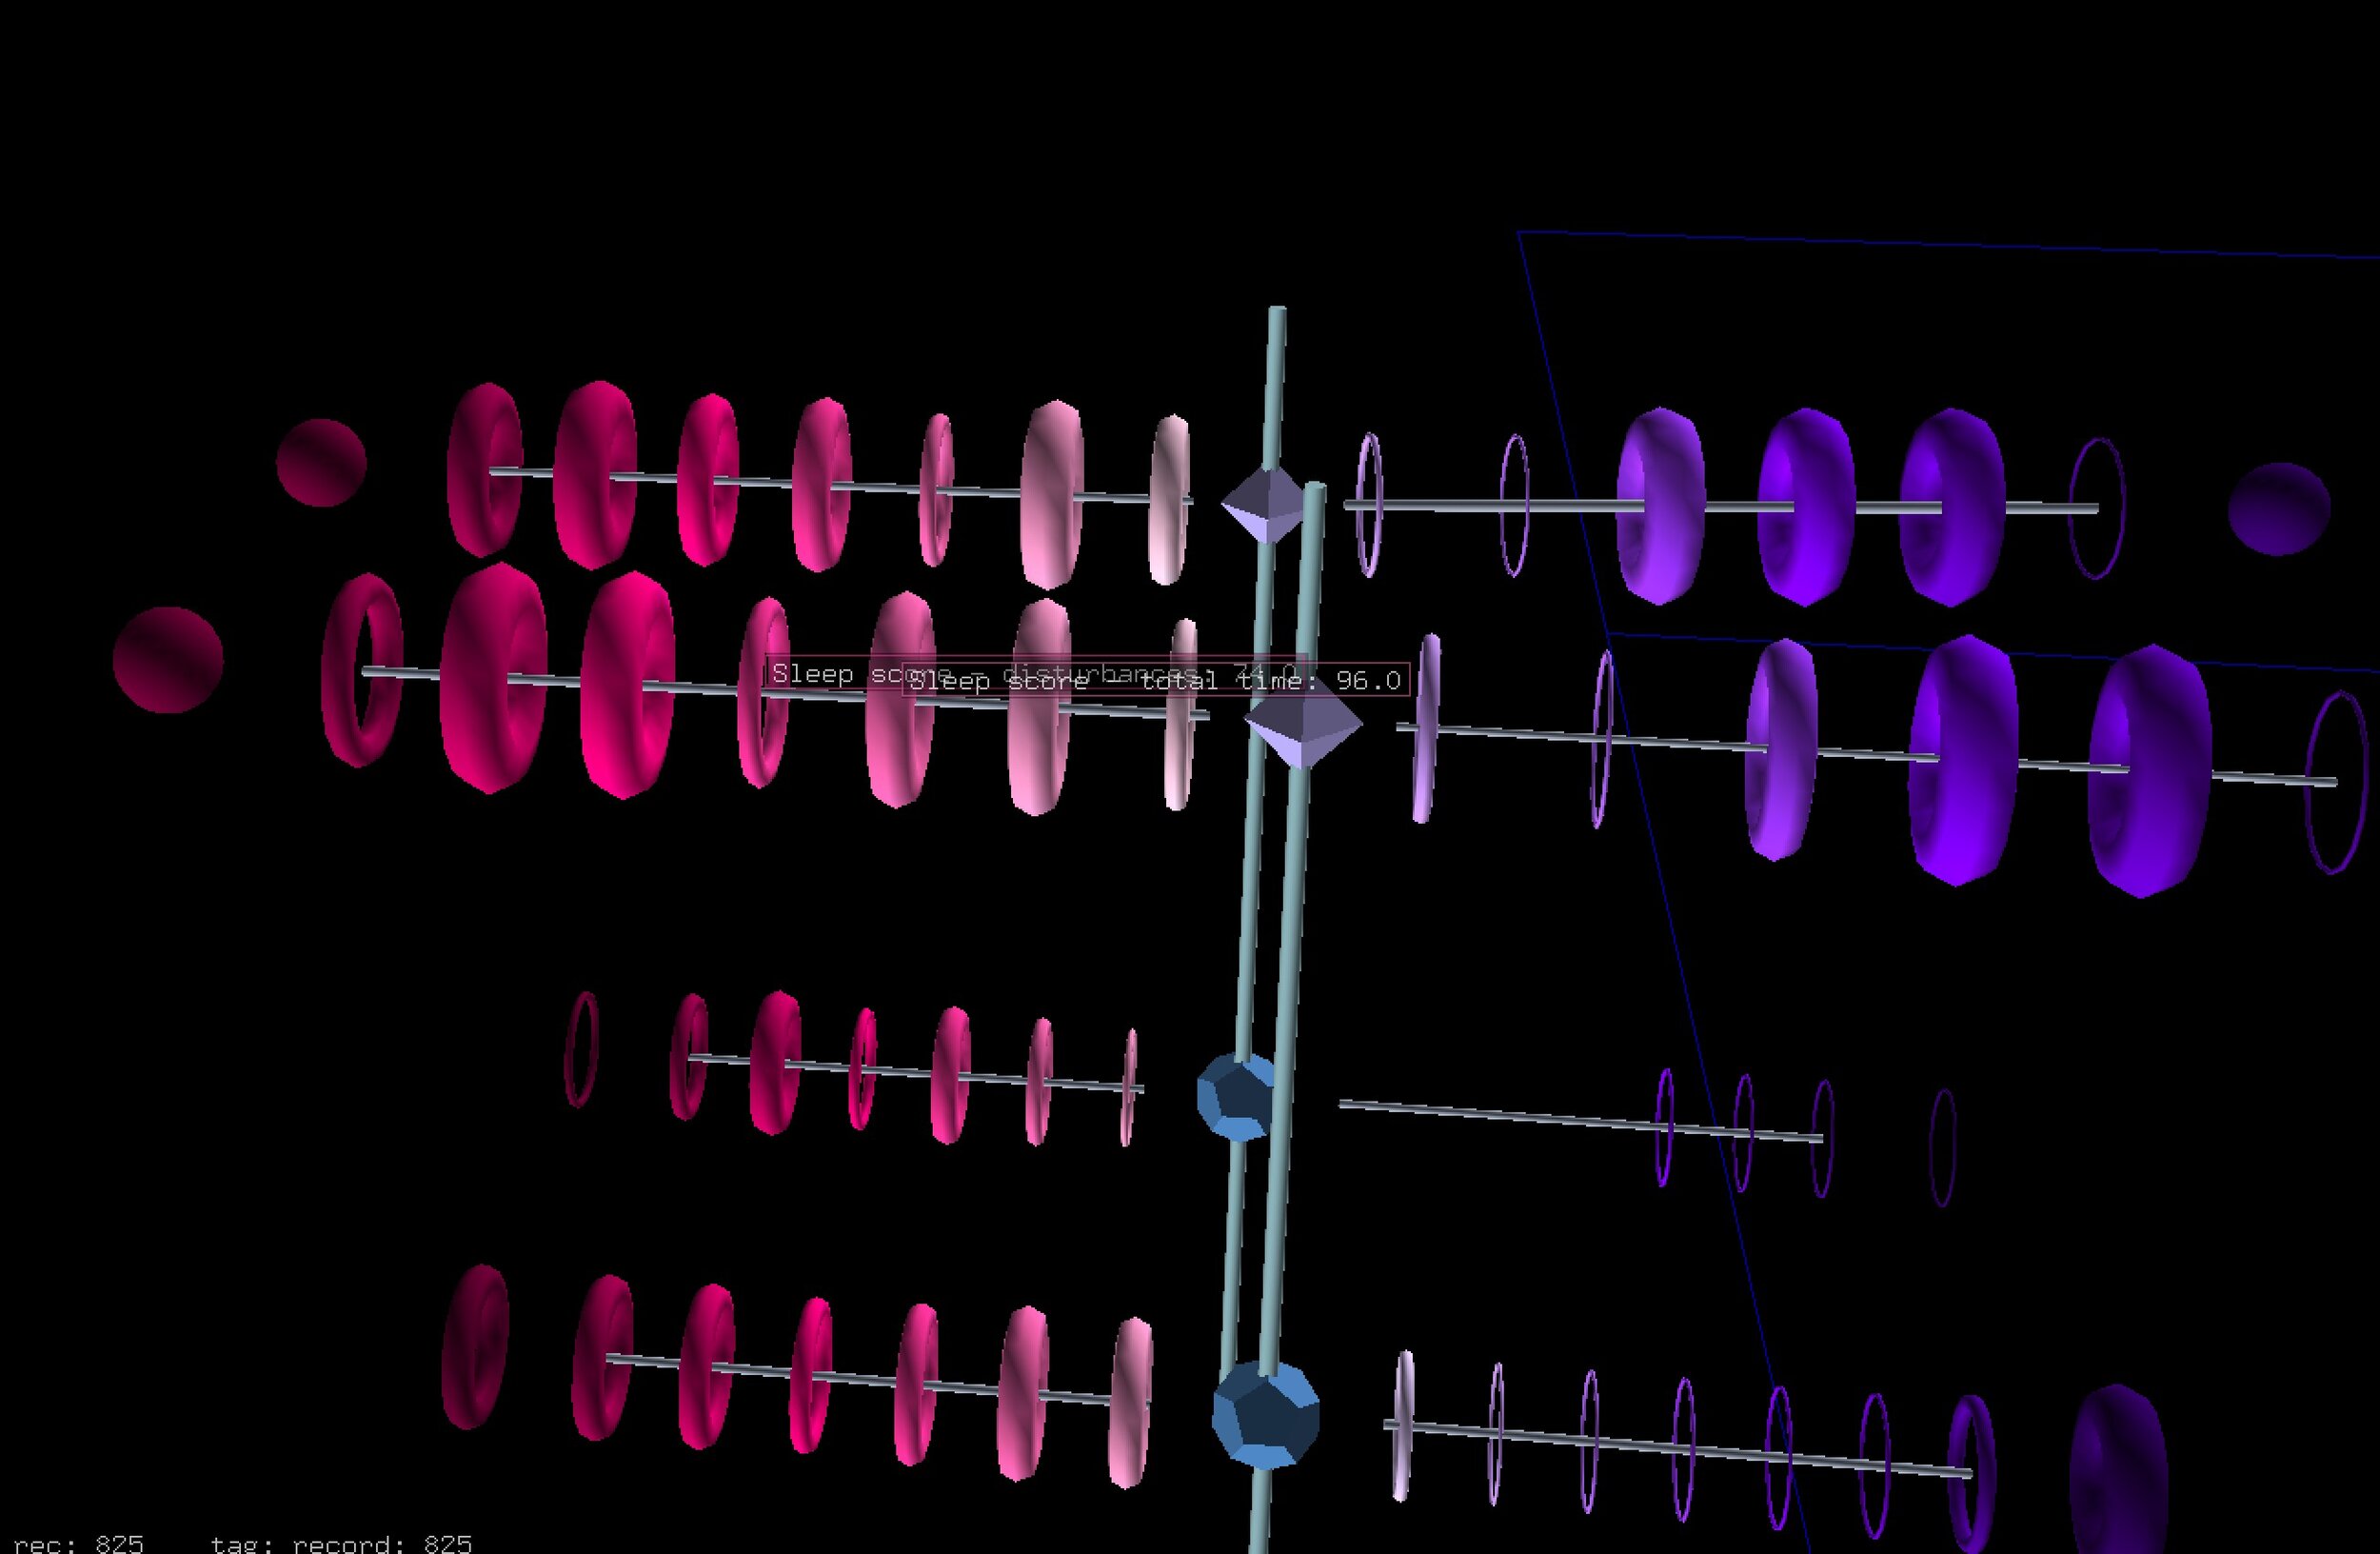
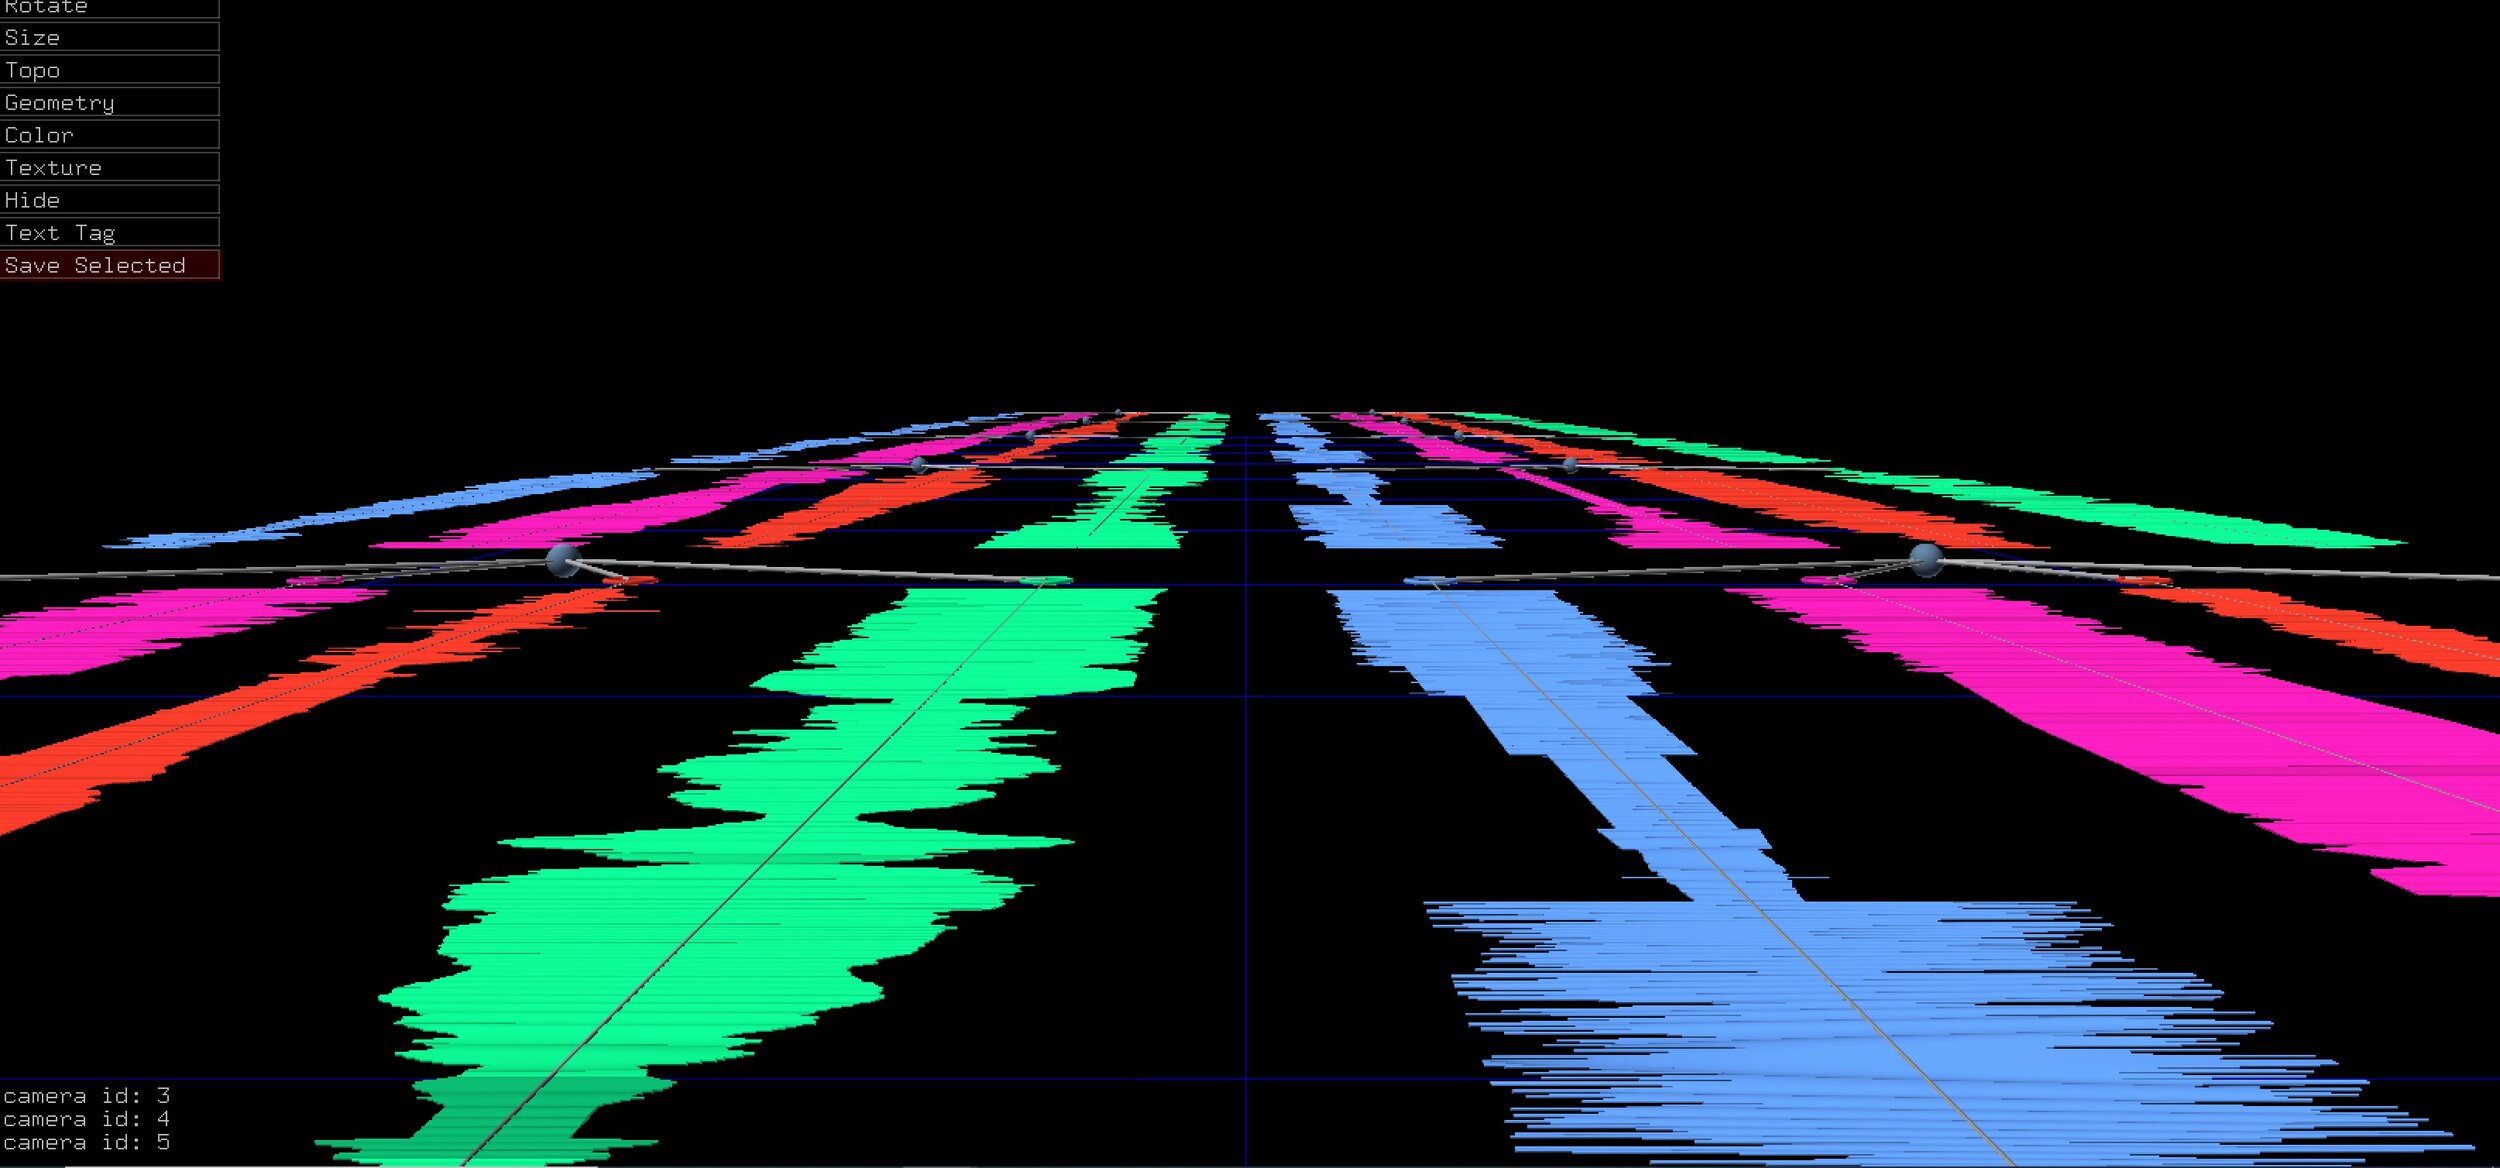
We’re testing different designs to show the 3 overall sleep, activity, and readiness scores per day alongside the 7-9 sub-scores for each of those areas.
An early part of the process is building several different designs by changing attributes like colors of the toroids, scale, the width ratio of the toroids, the angles of the rods extending from the central node to see what combination creates a better experience for the user.
Video walkthrough of the personal wearable glyphs
Blog Updates
Using Oura for Covid Detection
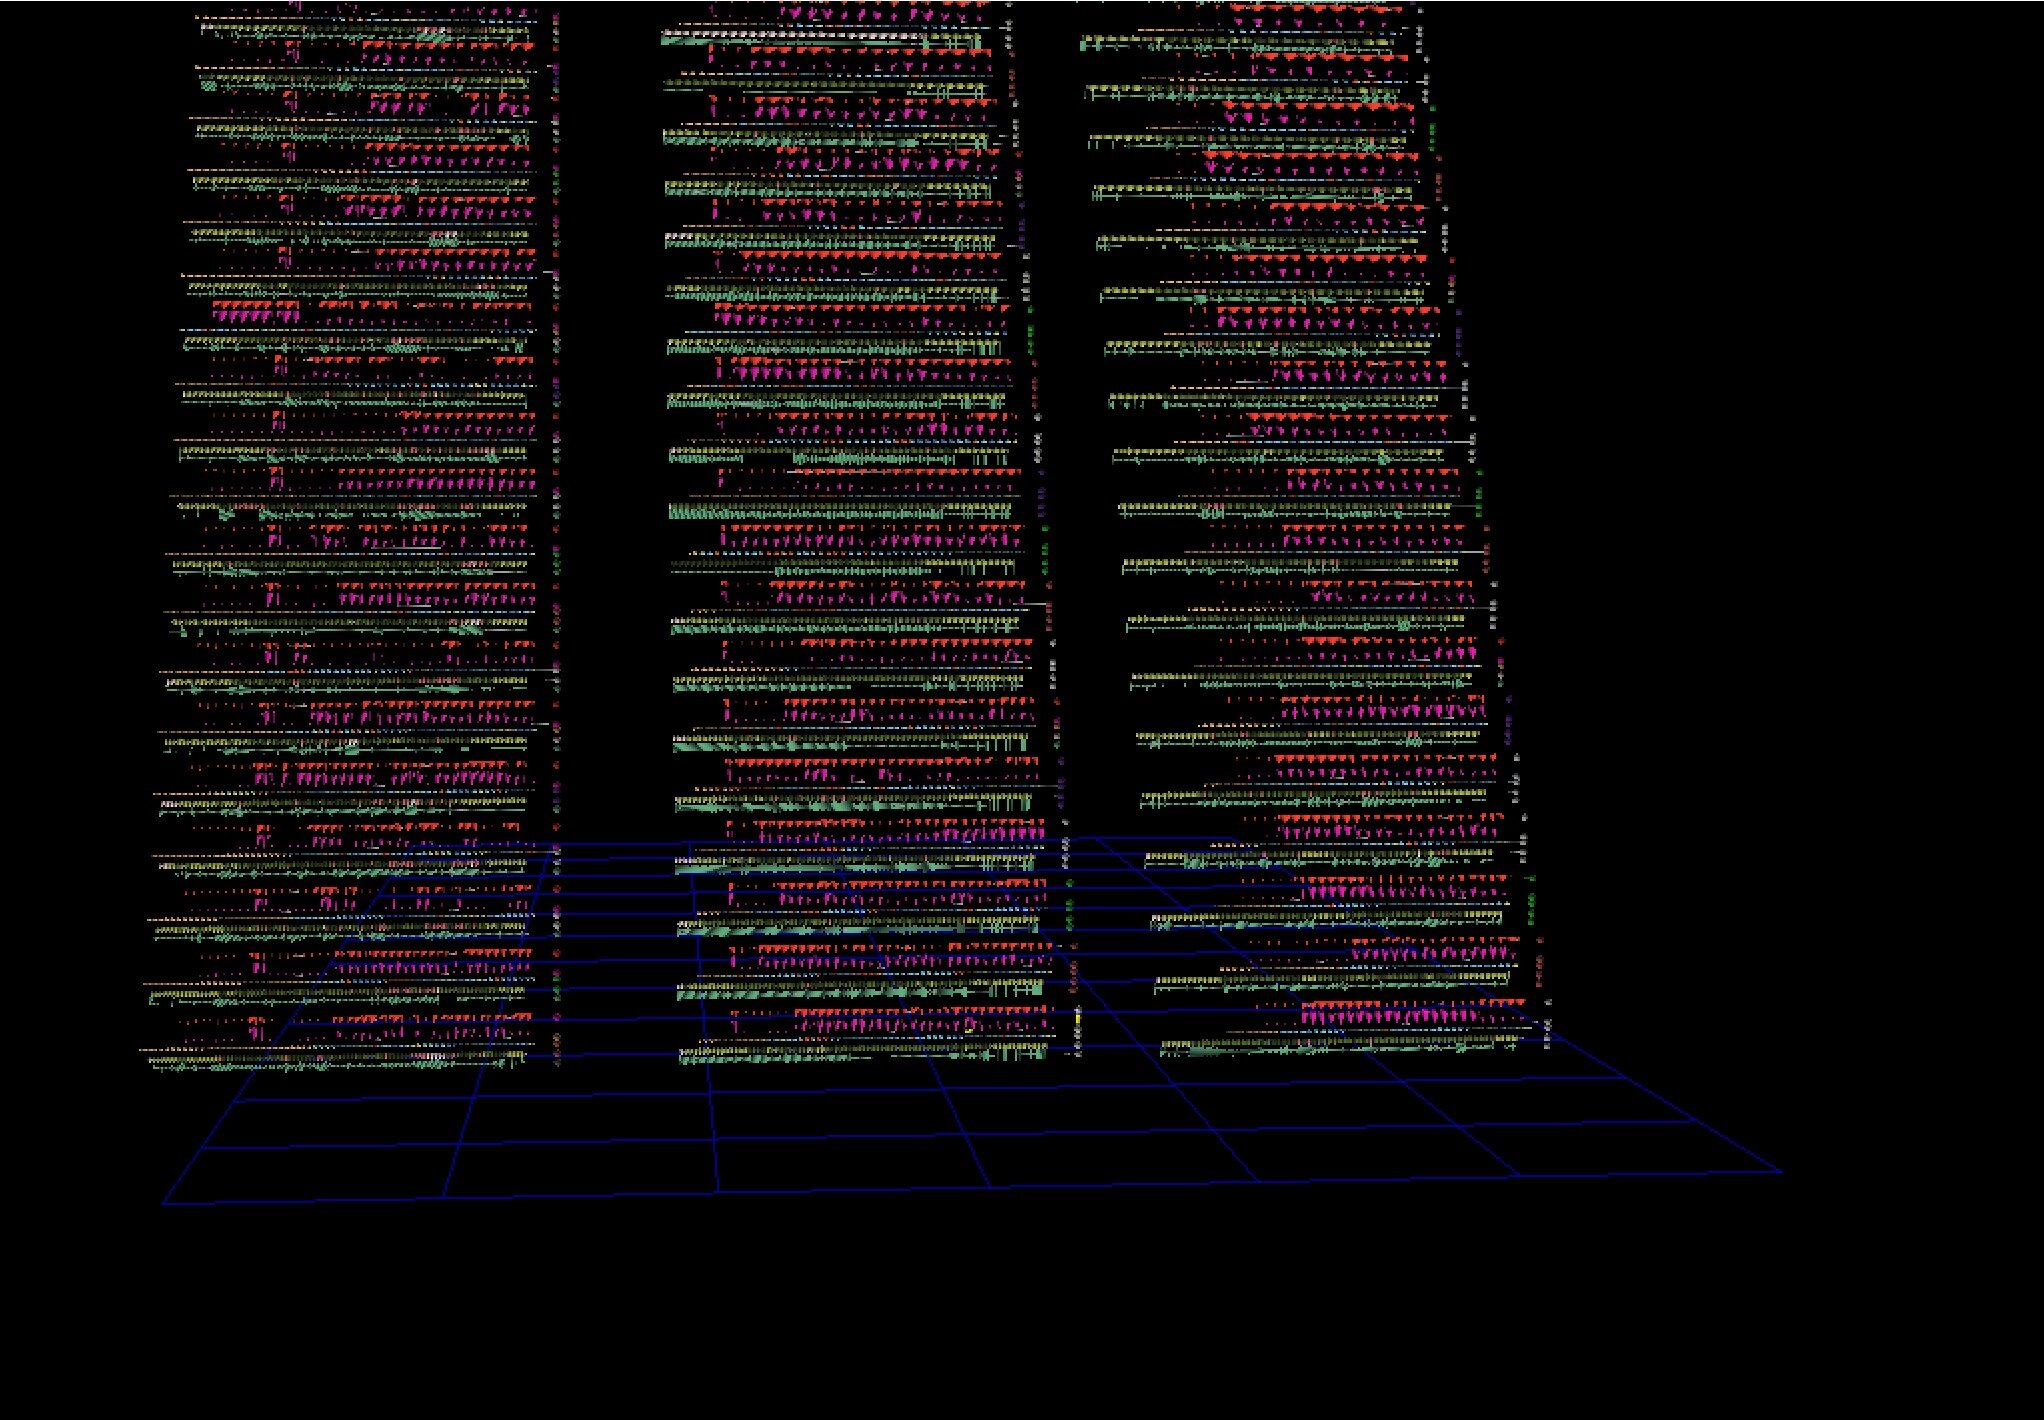
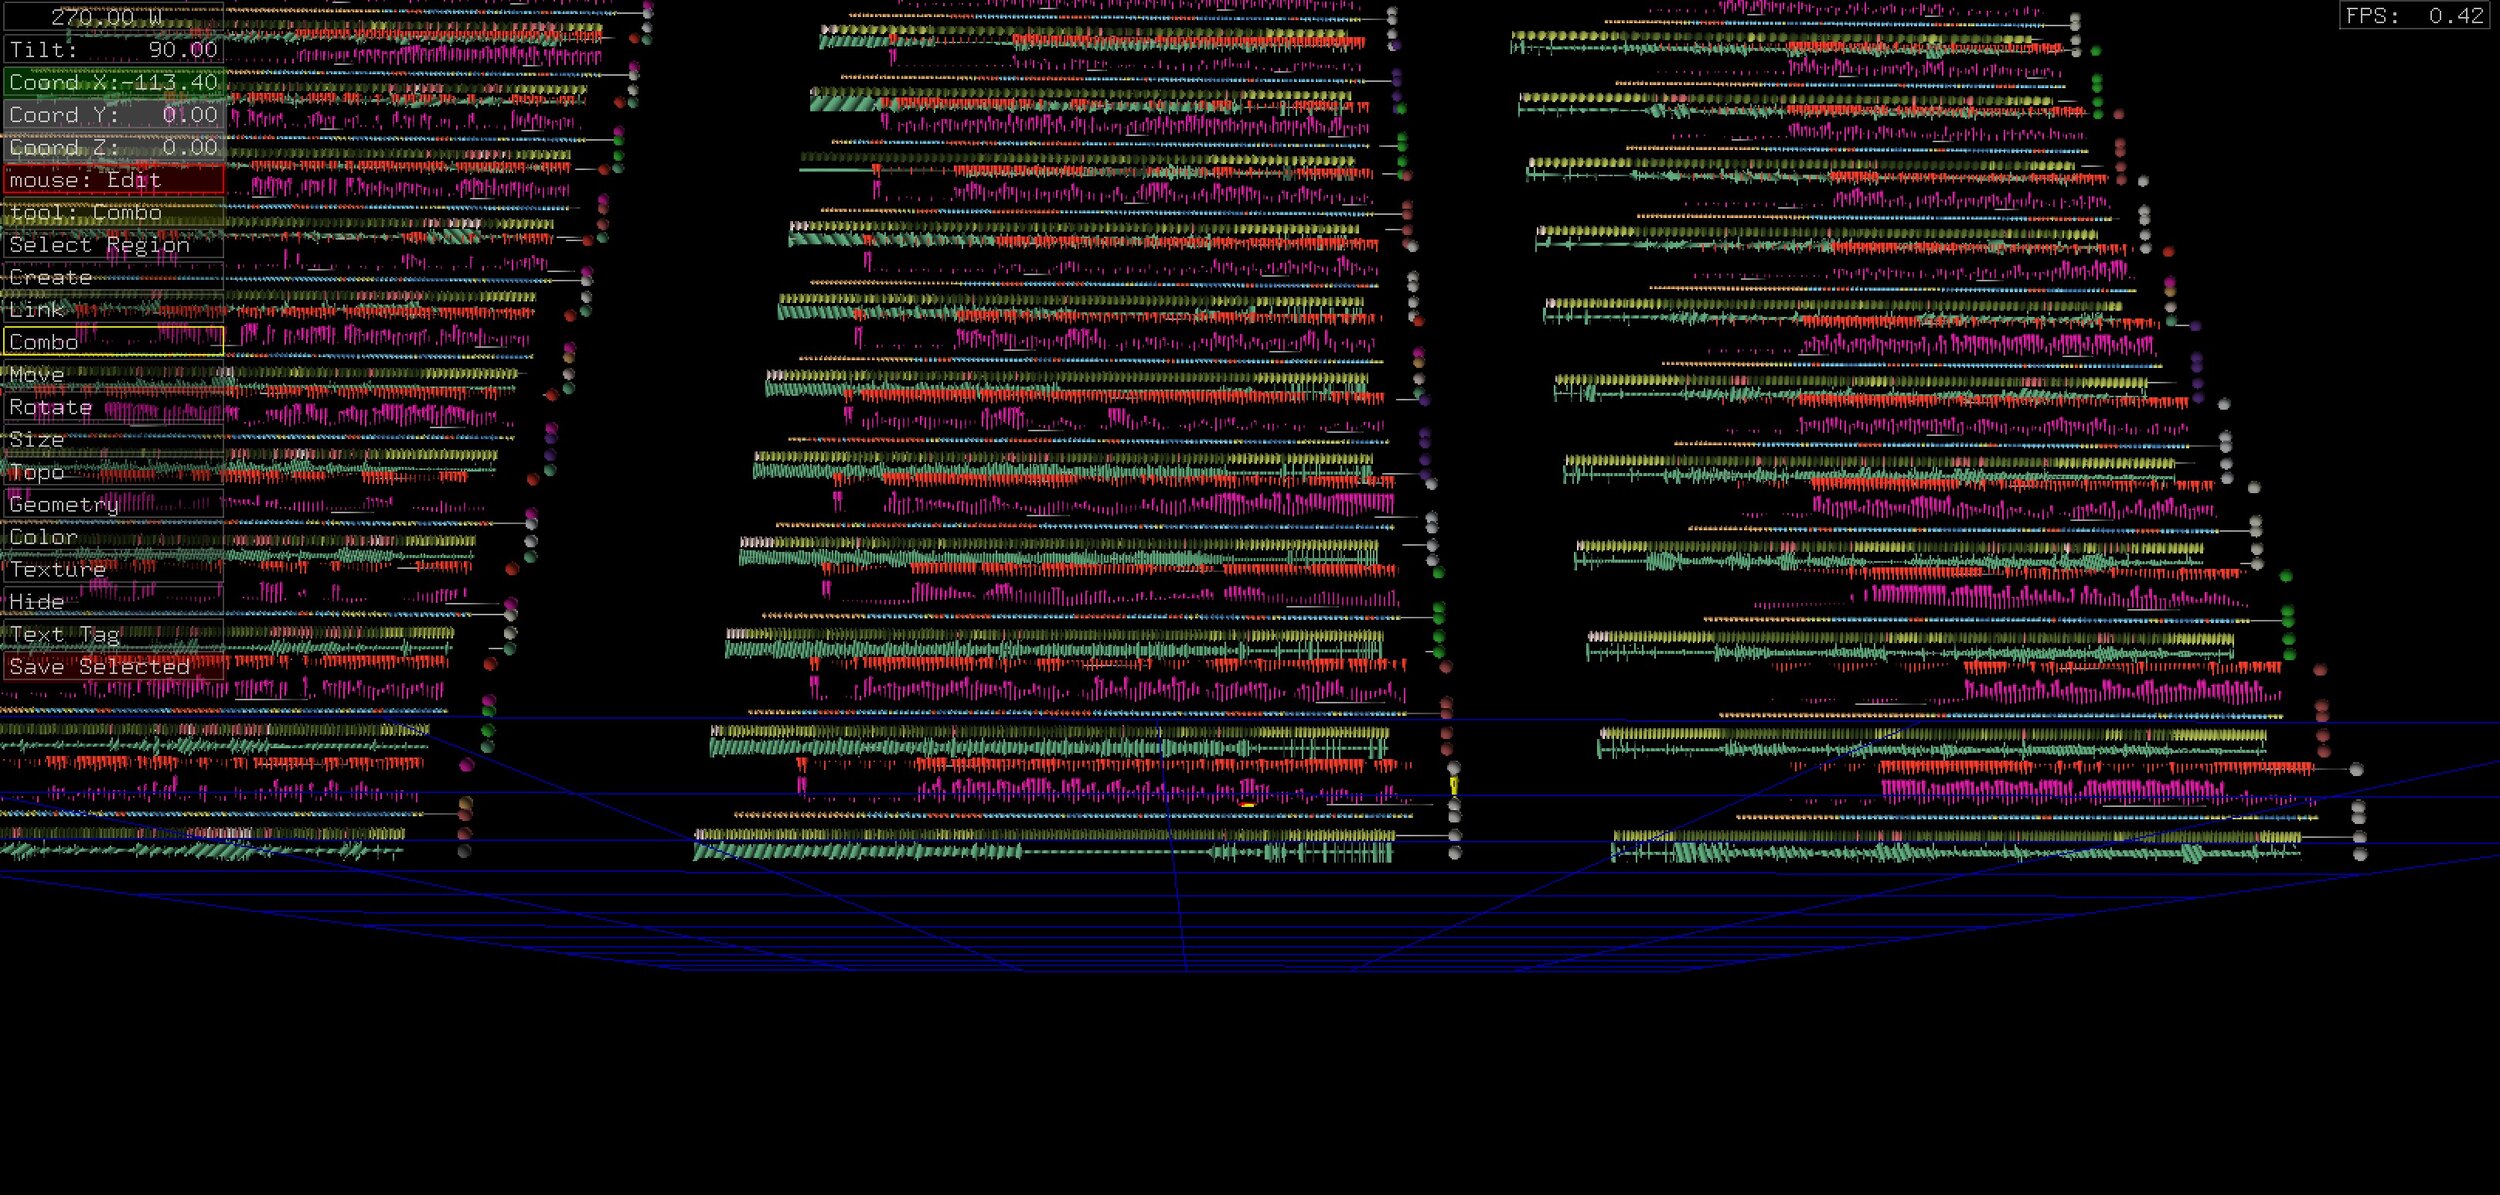
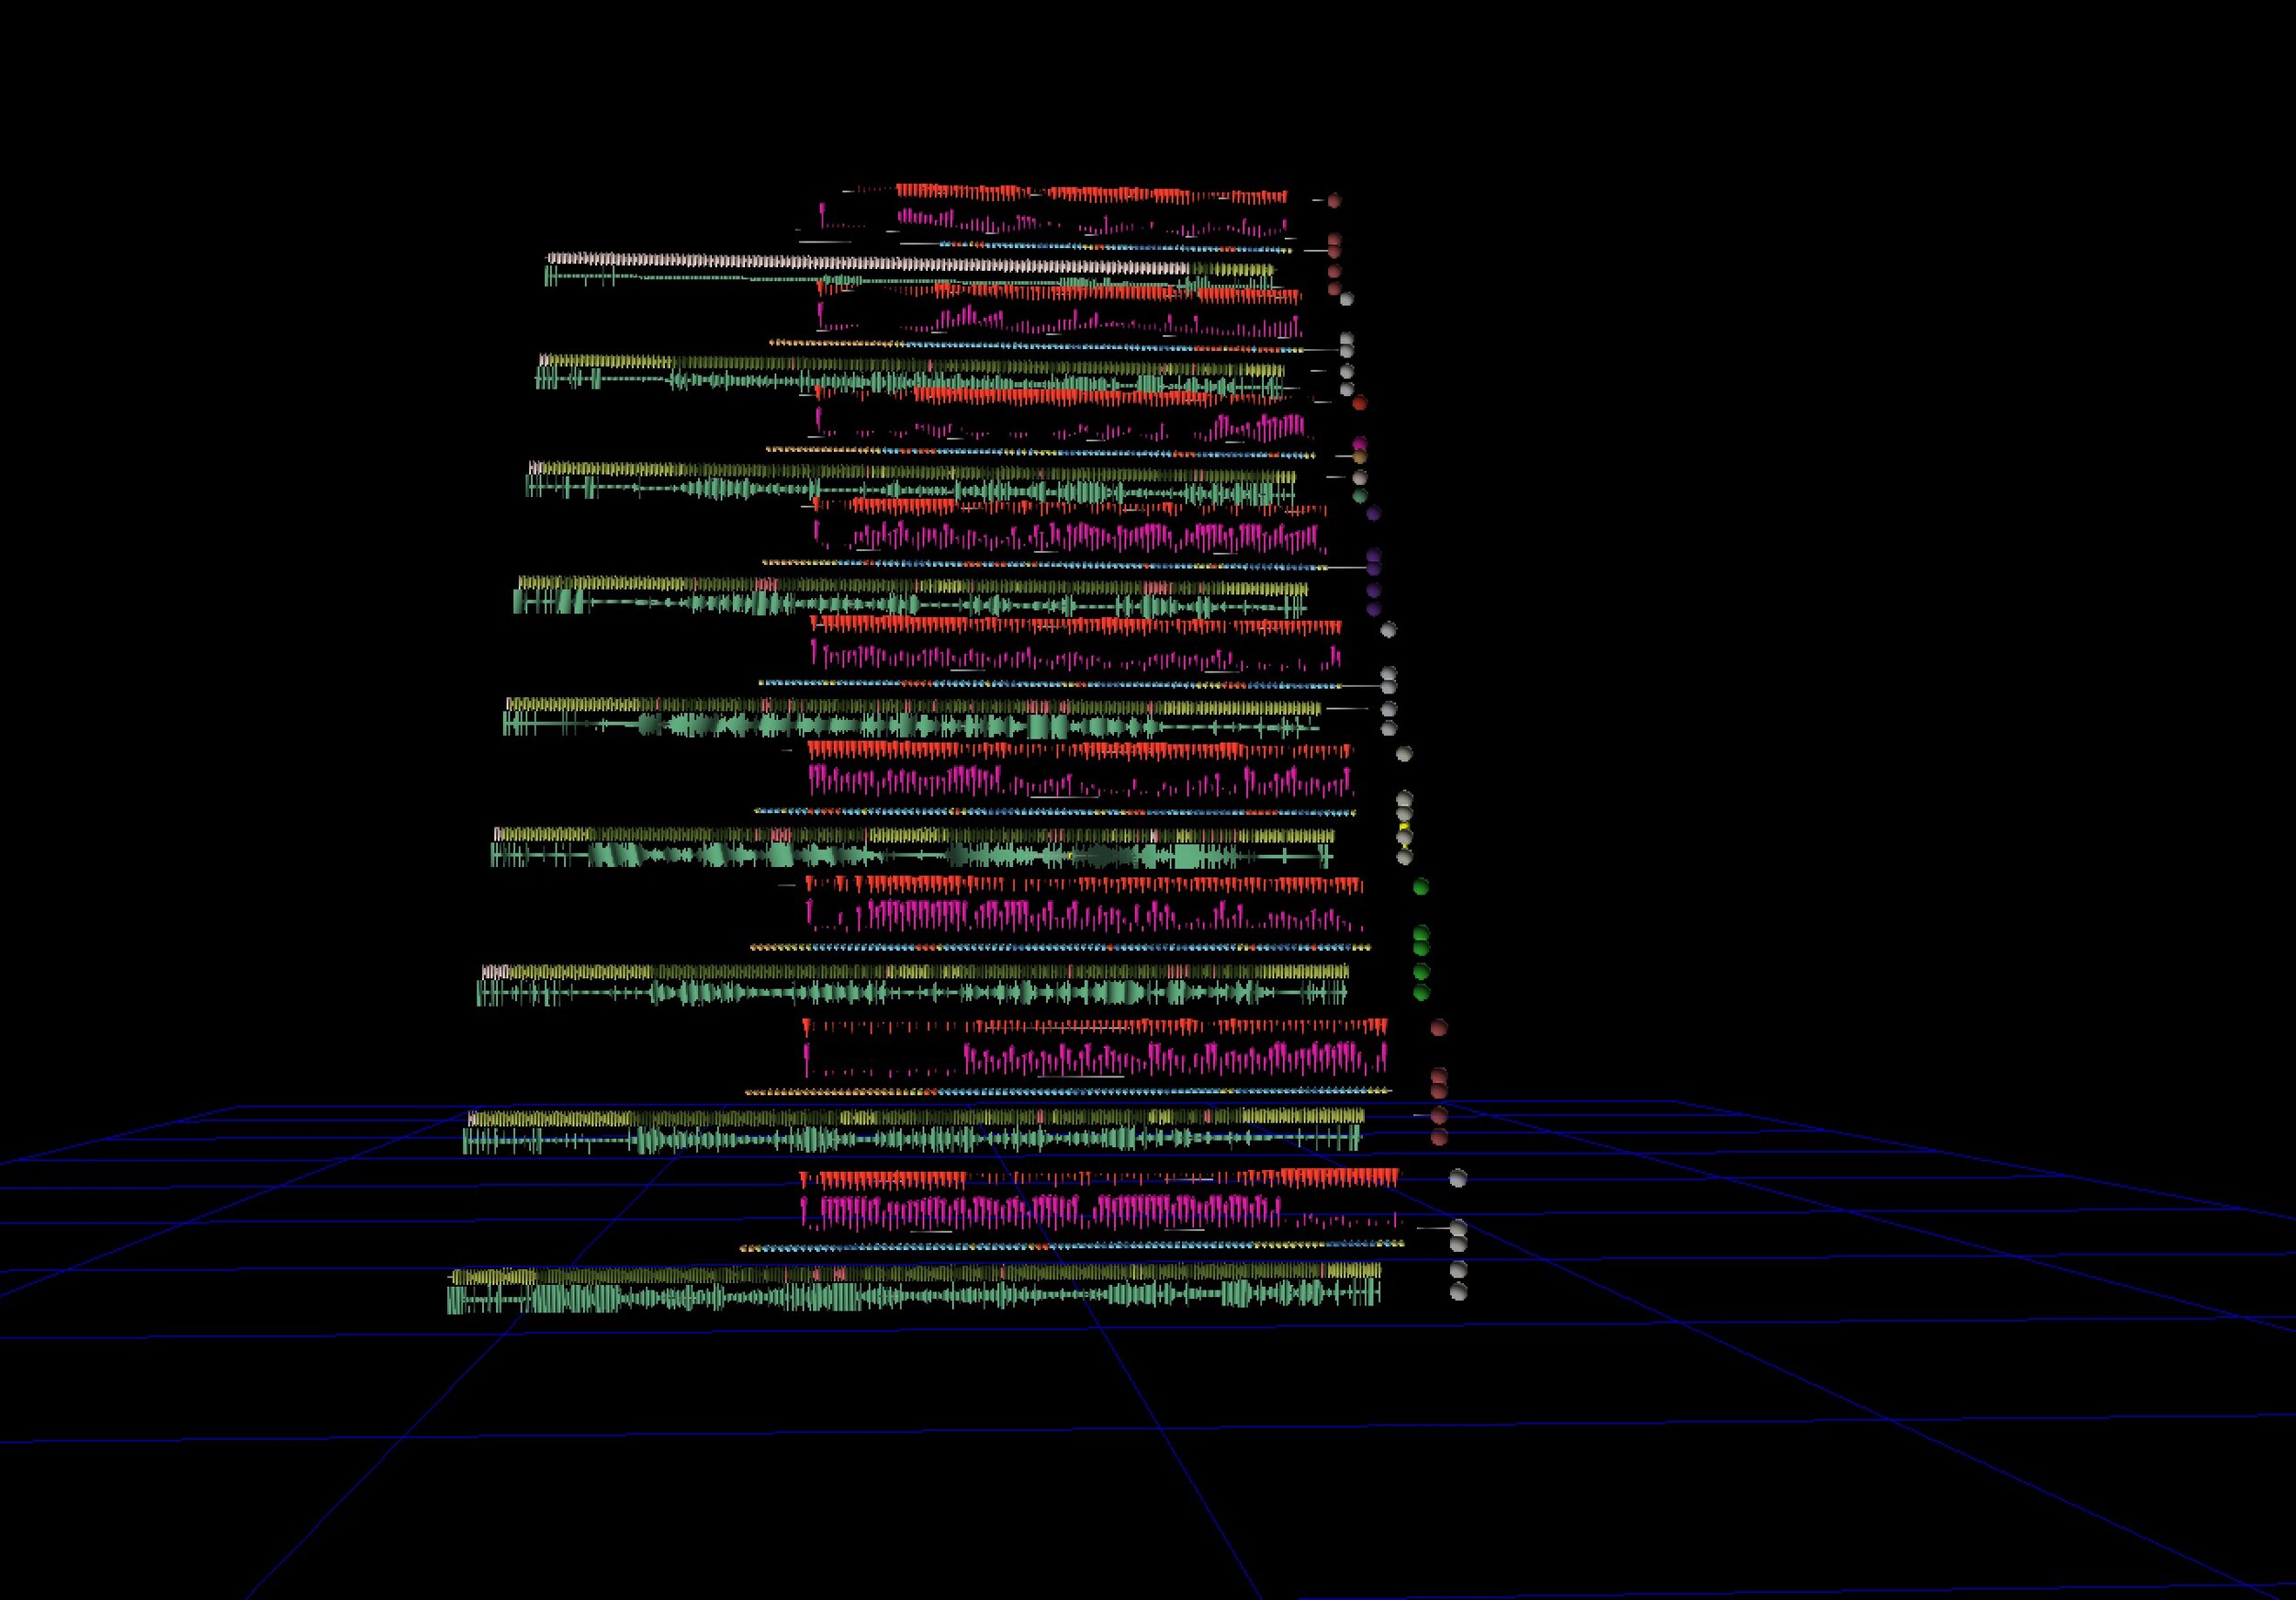
Each rod with the different colors is a different parameter every 1 minute, per person, per day visualized in OpenANTz.
There’s some indication that wearables like the Oura ring and Fitbit’s might be helpful in picking up early indications of Covid. More specifically, early research suggests four parameters - heart rate, heart rate variability, temperature, and breathing rate parameters - enable prediction of illness in the absence of symptom recognition.
We used data from the recently published paper, “Feasibility of continuous fever monitoring using wearable devices” to trial a few designs. They shared preliminary research from 65 days of data at 1 minute increments of the four parameters mentioned above, for 50 people who were diagnosed with Covid.


